
Intro
This post covers the next part of the CBA implementation, yet still a one before the initial release (a working POC published on GitHub, was still ahead).
The goal of this step was to make the controller observable (emitting metrics) and avoid candidate-selection bias.
Quick summary from the previous post
In the previous post, CBA got its first useful reconciler.
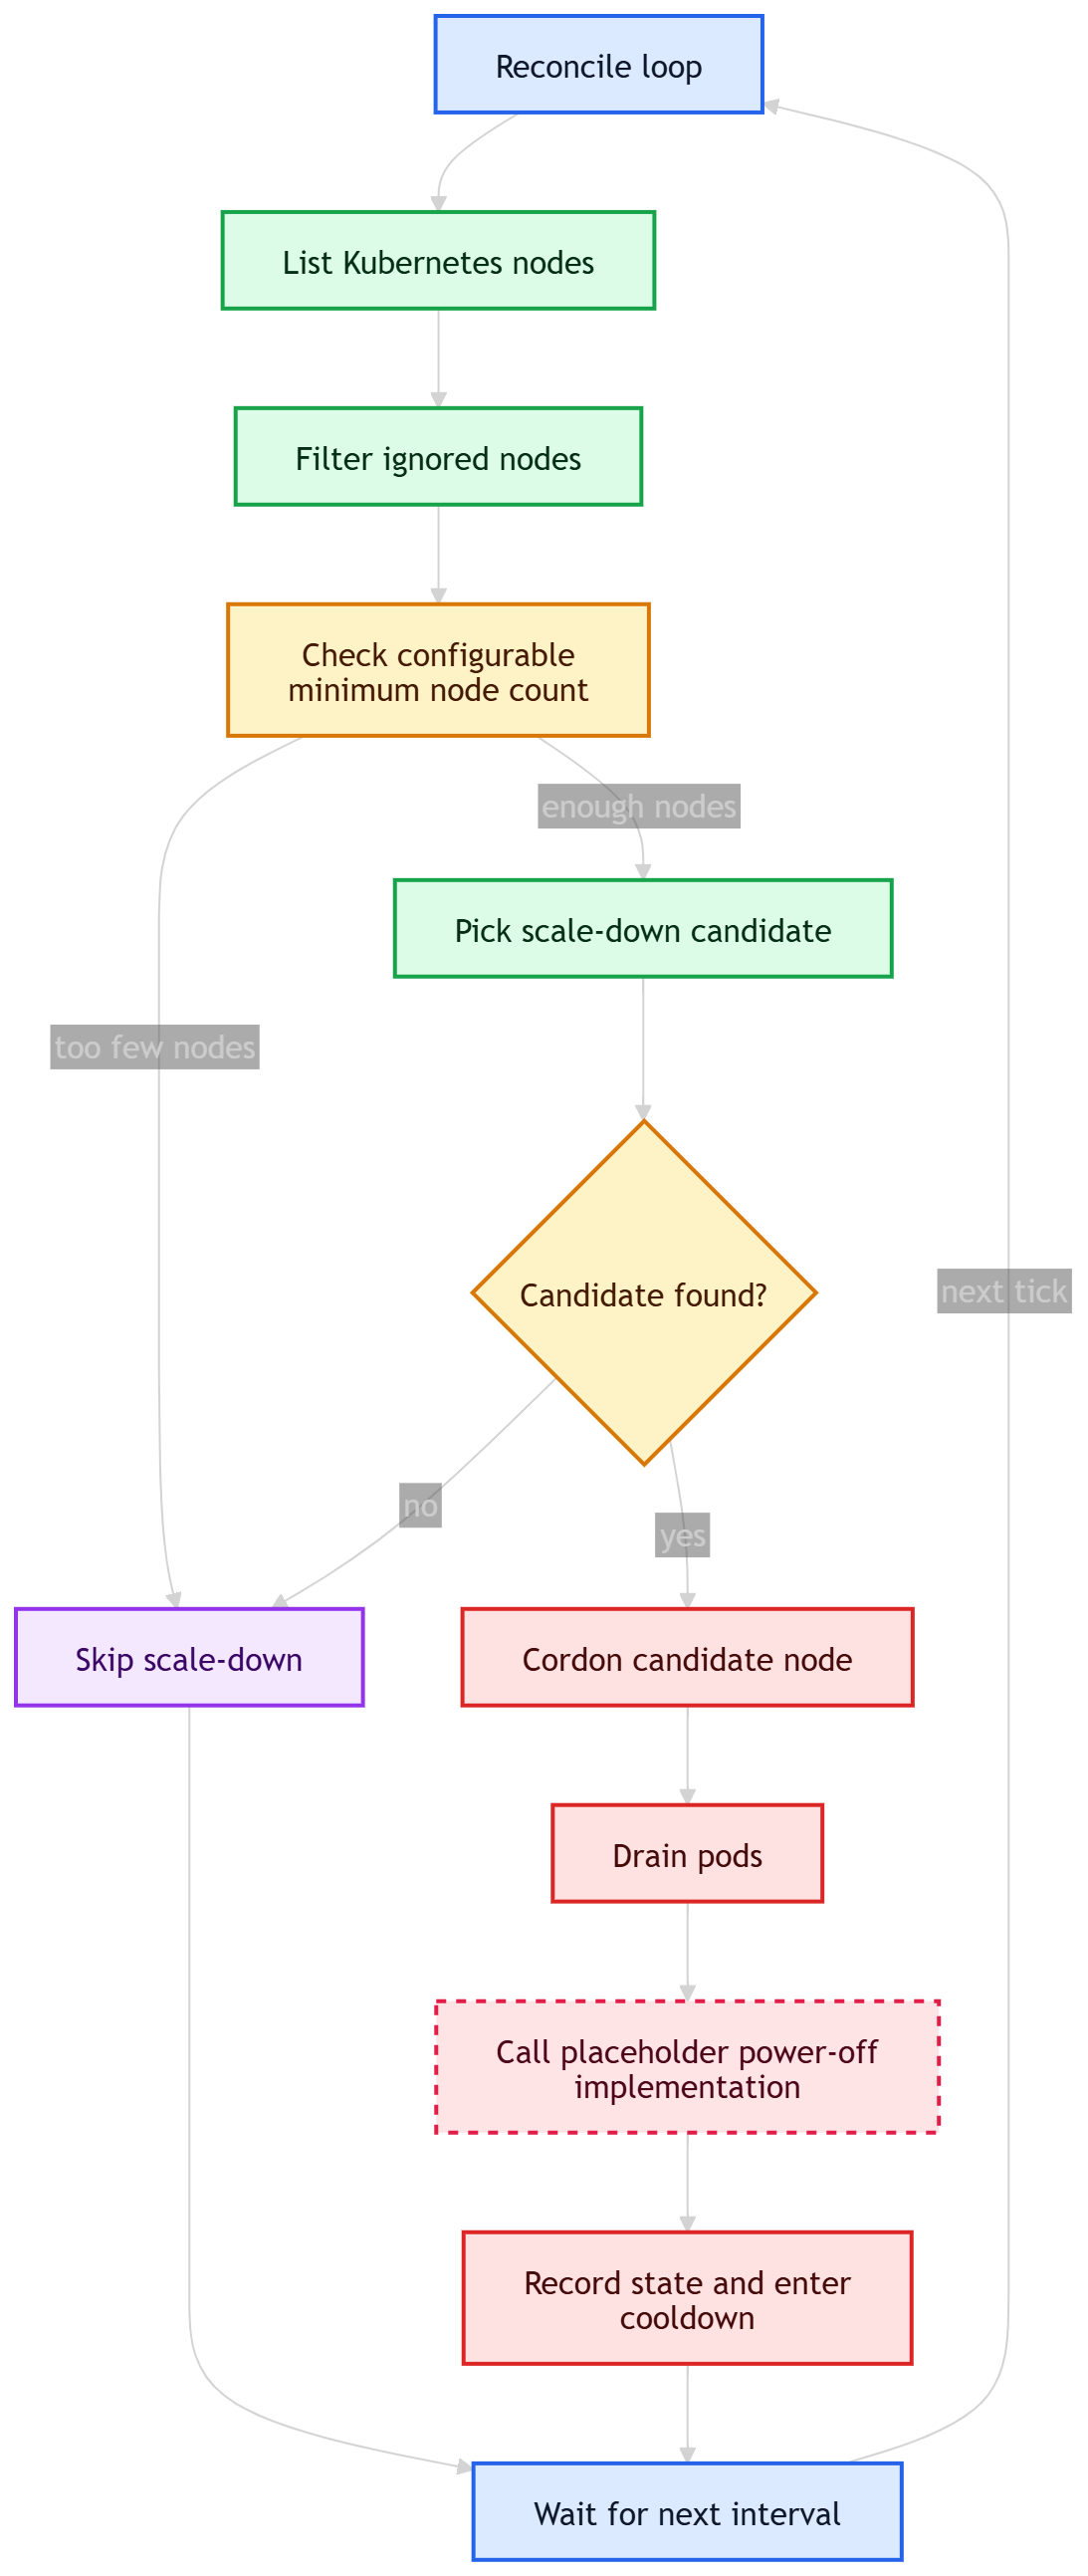
It could look at the Kubernetes cluster, list nodes, filter out nodes that should not be touched, pick a candidate for shutdown, and move toward the scale-down path. It also had early cooldown logic, because any autoscaler that acts repeatedly without waiting can very quickly become annoying, dangerous, or both.
At that stage, the reconciler was still the center of everything. It knew how to inspect the cluster, how to pick a candidate, and how to continue with the shutdown flow.
That was fine for the first implementation. It kept the code small and made the first control loop easier to build. Here's how it looked like at this stage:
Observability and metrics
Before extending scale-down with various strategies, I wanted to have eyes on the controller. This is especially important for software like an autoscaler as if it behaves incorrectly, it may cordon nodes, drain pods, shut machines down etc. So drawing some graphs to understand the behavior was crucial, from the very beginning.
The first observability step was basic Prometheus metrics. They are a natural fit for Kubernetes controllers, easy to scrape, easy to graph, easy to alert on, and they describe behavior over time.
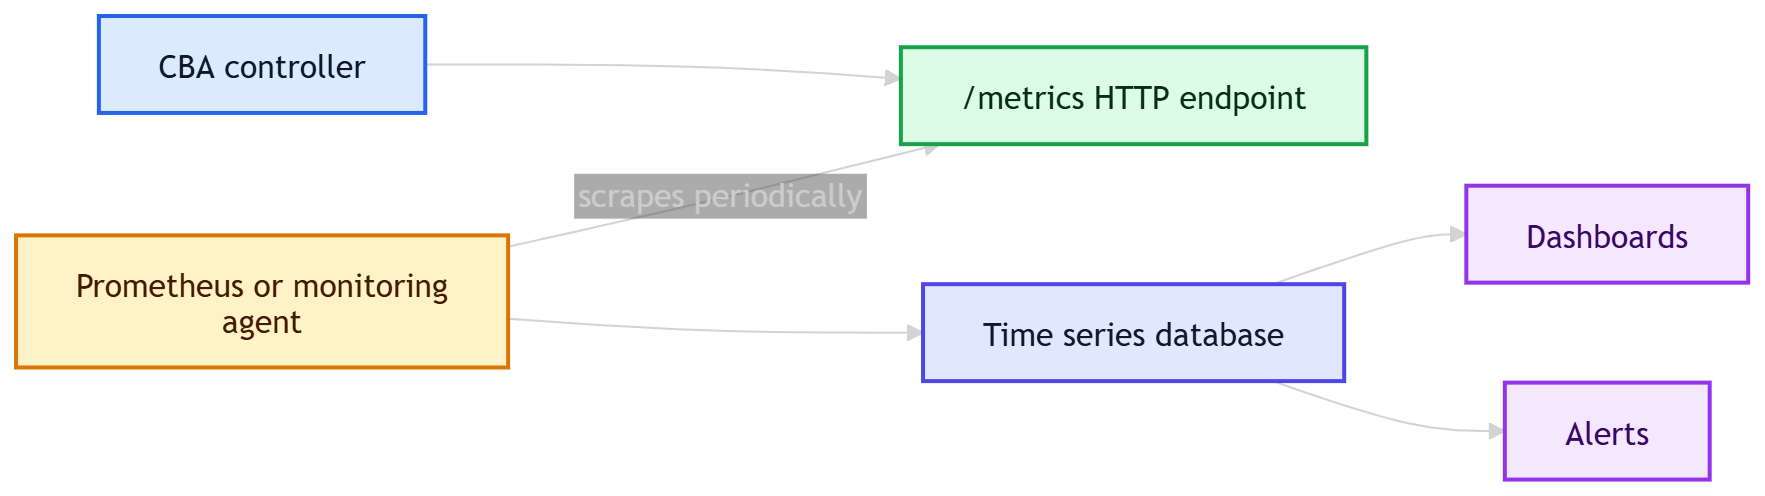
In practice, this means the application starts a small HTTP server and exposes a /metrics endpoint. The controller does not push metrics anywhere by itself. Instead, Prometheus or another compatible monitoring agent periodically calls that endpoint, reads the current metric values, stores them as time series, and later makes them available for dashboards, alerts, and queries:
Tracing is useful too, and CBA also got early OpenTelemetry spans soon after. But metrics and traces answer different questions. APM tracing can tell me what happened inside one reconcile loop. Metrics however can tell me whether the controller has been behaving normally for the given time.
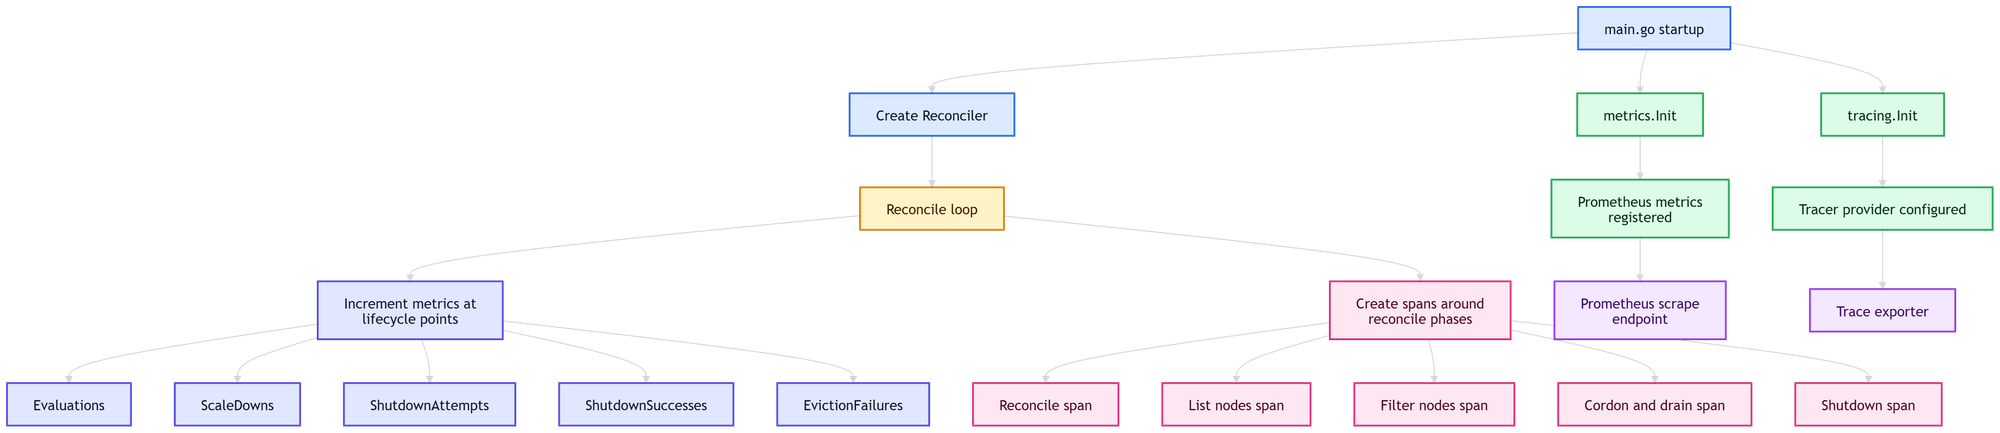
The first metrics were intentionally simple. The reconciler started incrementing counters around important points in the flow:
- `metrics.Evaluations`
- incremented when the reconcile loop evaluates the cluster
- answers: "is the controller loop alive and running?"
- `metrics.ScaleDowns`
- incremented when CBA decides to continue toward scale-down
- answers: "how often does the controller decide to act?"
- `metrics.ShutdownAttempts`
- incremented before calling the power controller shutdown path
- answers: "how often did CBA try to shut down a node?"
- `metrics.ShutdownSuccesses`
- incremented after shutdown was successfully initiated
- answers: "how often did the shutdown path succeed?"
- `metrics.EvictionFailures`
- incremented when eviction fails during drain
- answers: "how often was scale-down blocked during pod eviction?"
The wiring was also intentionally simple. A dedicated metrics package owned the metric definitions and initialization. `main.go` initialized metrics during startup. The reconciler imported the metrics package and incremented counters at stable lifecycle points.
That is a pragmatic early design. It is not the most flexible form of instrumentation. A more elaborate design could inject a metrics recorder into the reconciler, which would make testing and swapping implementations cleaner. But at this stage, package-level Prometheus counters were simple and easy to work with.
The important part was the separation of concerns:
- the metrics package registered and exposed metrics
- the reconciler emitted signals at meaningful points
- metrics did not decide anything
- the decision logic stayed in the controller flow
Candidate selection bias
At this stage, CBA built a list of eligible nodes and selected a scale-down candidate from that list. The list itself was a Go slice, created from Kubernetes NodeList.Items:
func (r *Reconciler) pickScaleDownCandidate(eligible []v1.Node) *v1.Node {
	if len(eligible) <= r.cfg.MinNodes {
		return nil
	}
	return &eligible[len(eligible)-1]
}
That meant the selected candidate depended on the order returned by the Kubernetes API and then on a fixed "pick the last one" rule.
If the Kubernetes API returned nodes in a stable or mostly stable order, CBA would tend to pick the same node again and again. Without shuffling, the main protections against immediately reusing that same node were cooldown and internal powered-off state tracking. Those protections were useful, but they did not solve the selection bias itself.
Cooldown answers a different question:
"Should the controller wait before acting again?"
It does not answer:
"Are we distributing scale-down choices fairly across eligible nodes?"
So I decided to shuffle the eligible node list before selecting a candidate:
rand.Seed(time.Now().UnixNano())
rand.Shuffle(len(eligible), func(i, j int) {
	eligible[i], eligible[j] = eligible[j], eligible[i]
})
This was not a sophisticated scheduling algorithm - it didn't rank nodes by age, hardware class, power usage, previous shutdown history, workload profile etc. But that was good enough for this stage. The autoscaler still picked a candidate in a very simple way, but it no longer silently preferred whichever node happened to appear last in the API response.
This is one of those small changes that does not look very impressive in code, but it improves the behavior of the system. Especially in a controller, deterministic bias can hide for a long time and only become visible once the same machine is selected again and again in real use.
That's it for this part
The next post will cover the first version of the pluggable strategy design, how it was wired into the reconciler, and how the first resource-aware scale-down strategy started checking whether the remaining cluster had enough capacity to handle existing workloads.
Discussion time
If you have some questions, ideas or observations related to this blog entry, head to the Github discussions - there's a dedicated topic for this post!

