Problem?
Another day in work and I find out that in one of our projects unit tests suite executes in about 13 seconds. Wow! It was like 200ms before, so what happened?
Btw - this particular project is a Python Google/AppEngine application. We use UnitTest framework for unit tests as well as mock library.
One could say that it's not a problem as you don't test that often. Unless you do. In Ocado we really do TDD everywhere. E.g. in this particular project Guacamole we have git hooksthat run unit - tests on every git commit. That's why we really want unit tests to run very fast. Personally I think that unit test suite that executes in more than 0,5s is broken.
One more thing. In order to run our tests we use tests_runner.pyprovided by Google - it's a tool that loads GCP SDK as well as detects our tests in project directory and run suite. It's important, as it's just another complication.
So it looks like:
$ python tests_runner.py --test-path tests/ --test-patt \
  ern 'test*.py' /home/somewhere/google-cloud-sdk

------------------------------------------------------- \
---------------
Ran 47 tests in 13.105s

OK
You see? 13 seconds to run 47 tests - disgusting!
Tests look fine
So I git log / diff and I saw that we've got couple of new tests. But each of those tests brought something good to our projects, so it wasn't about removing those tests, but rather checking where is the root cause. I didn't want to remove any tests just because it executes slow. I wanted to find out why tests run slow and fix it.
Let's cProfile!
So I thought that I'll try with profiling those tests. In Python there're couple of ways to do it. I know great cProfilemodule:
$ python -m cProfile -s totime tests_runner.py --test-p \
  ath tests/ --test-pattern 'test*.py' /home/somewhere/ \
  google-cloud-sdk

------------------------------------------------------- \
---------------
Ran 47 tests in 13.304s

OK

   ncalls  tottime  percall  cumtime  percall filename: \
   lineno(function)
       18    1.445    0.080    1.445    0.080 {method ' \
       connect' of '_socket.socket' objects}
       18    1.310    0.073    1.310    0.073 {method ' \
       do_handshake' of '_ssl._SSLSocket' objects}
       18    0.833    0.046    0.833    0.046 {_socket. \
       getaddrinfo}
     9378    0.757    0.000    0.757    0.000 {method ' \
     read' of '_ssl._SSLSocket' objects}
       18    0.186    0.010    0.186    0.010 {method ' \
       set_default_verify_paths' of '_ssl._SSLContext' \
       objects}
       36    0.109    0.003    0.109    0.003 decoder.p \
       y:370(raw_decode)
       18    0.096    0.005    0.096    0.005 {method ' \
       load_verify_locations' of '_ssl._SSLContext' obj \
       ects}
      305    0.028    0.000    0.826    0.003 socket.py \
      :410(readline)
...
(cut rest as it's not that interesting)
So as you can see - I sorted all calls by total time. So _socket.socket.connect()was called 18 times and it took circa 1,5s. Wow! And another 2 seconds on SSL socket manipulations. Wow and WTF? I mean - unit tests creating any socket connections and involving SSL processing?
But from this point I just see that some of libraries used in the whole stack (in this situation _socket and _ssl) take a bunch of time to process some request. But searching for those particular calls can be like searching for a needle in the haystack. I could use pdbdebugger and debug those tests (or in Pycharm's builtin debugger that I find much more handy) but still - debugging take a lot of time.
Let's visualize problem!
I love Python because it provides me with so many tools and libs created by great community. So there is this gprof2dotconverter that takes output from cProfile and generates SVG graphs visualizing calls. Wow!
Actually this tool visualizes output from much more tools (see docs) - that makes it very generic and valuable.
So I re-run profiler, wrote profile data to a file and generated an SVG file:
$ python -m cProfile -o guacamole.pstats tests_runner.p \
  y --test-path tests/ --test-pattern 'test*.py' /home/ \
  somewhere/google-cloud-sdk

...

$ gprof2dot -f pstats guacamole.pstats | dot -Tsvg -o g \
  uacamole.svg
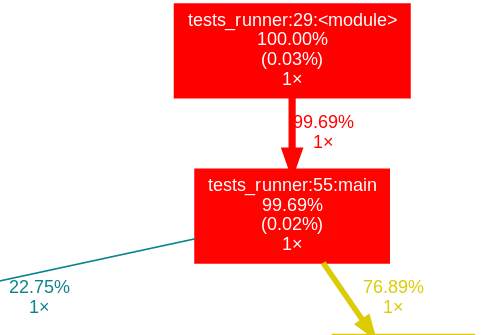
And I saw this (click to see larger SVG):

Wow! So now following coloured path we might see that:
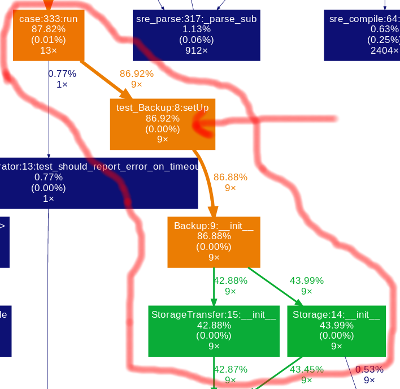
So actually test_Backup.py contains problematic tests (almost 87% of time consumed). Moreover it is setUp fixture:
class test_Backup(unittest.TestCase):
    def setUp(self):
        self.testbed = testbed.Testbed()
        self.testbed.activate()
        self.Backup = Backup()
And going further it is Backup constructor init:
class Backup(object):
    def __init__(self):
        self.Storage = Storage()
        self.StorageTransfer = StorageTransfer()
And even further it is about time taken to invoke constructors of Storageand StorageTransfer. Let's see:
class Storage(object):
    def __init__(self):
        self.http = httplib2.Http()
        self.service = googleapiclient.discovery.build(
            'storage',
            'v1',
            credentials=some_method(),
            http=self.http
        )
class StorageTransfer(object):
    def __init__(self):
        self.http = httplib2.Http(timeout=60)
        self.service = googleapiclient.discovery.build(
            'storagetransfer',
            'v1',
            credentials=some_method(),
            http=self.http
        )
So where's the problem? Above code is a standard authentication for GCPand we thought it will be mocked by testbed.activate() (provided by Google) on some level. But as we can see - it wasn't. So every test we run there is an instance of googleapiclient.discovery.build created - and this object basically does all the authentication based requests (thus SSL, requests lib etc involved).
Solution - simple mock!
So the solution was quite simple. We decided to mock whole googleapiclient.discovery.build and that should do the trick:
from google.appengine.ext import vendor
from mock import Mock

vendor.add('lib')

import googleapiclient.discovery # nopep8 pylint: disab
le=C0413
class test_Backup(unittest.TestCase):
    def setUp(self):
        googleapiclient.discovery.build = Mock()
        self.testbed = testbed.Testbed()
        self.testbed.activate()
        self.Backup = Backup()
And...:
$ python tests_runner.py --test-path tests/ --test-patt \
  ern 'test*.py' /home/somewhere/google-cloud-sdk

------------------------------------------------------- \
---------------
Ran 47 tests in 0.047s

OK
Yes! It worked like a charm! From almost 13 seconds down to 0.047 seconds. That is a 27659% improvement, nice!
Foreword
One more thing. Our original implementation of e.g. Storage() was:
from googleapiclient.discovery import build

class Storage(object):
    def __init__(self):
        self.http = httplib2.Http()
        self.service = build(
            'storage',
            'v1',
            credentials=some_method(),
            http=self.http
        )
But we had to mock the whole loading context:
googleapiclient.discovery.build = Mock()
This wouldn't work as it would mock build() from other namespace. So we basically refactored a bit of Storage():
import googleapiclient.discovery # nopep8 pylint: disab
le=C0413

class Storage(object):
    def __init__(self):
        self.http = httplib2.Http()
        self.service = googleapiclient.discovery.build(
            'storage',
            'v1',
            credentials=some_method(),
            http=self.http
        )
And now mocking started working. So - profile, visualize and mock! Keep your unit - tests under 0,5s!

