Bokeh for Python data visualization
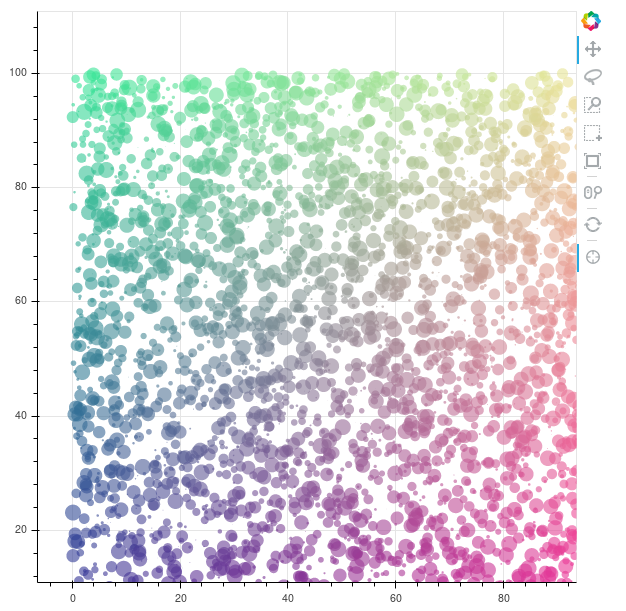
Above image was generated by the following code:
import numpy as np

from bokeh.plotting import figure, output_file, show

# prepare some data
N = 4000
x = np.random.random(size=N) * 100
y = np.random.random(size=N) * 100
radii = np.random.random(size=N) * 1.5
colors = [
    "#%02x%02x%02x" % (int(r), int(g), 150) for r, g in zip(50+2*x, 30+2*y)
]

# output to static HTML file (with CDN resources)
output_file("color_scatter.html", title="color_scatter.py example", mode="cdn")

TOOLS="resize,crosshair,pan,wheel_zoom,box_zoom,reset,box_select,lasso_select"

# create a new plot with the tools above, and explicit ranges
p = figure(tools=TOOLS, x_range=(0,100), y_range=(0,100))

# add a circle renderer with vectorized colors and sizes
p.circle(x,y, radius=radii, fill_color=colors, fill_alpha=0.6, line_color=None)

# show the results
show(p)
Thanks to Bokeh library. Wow!
Above example was taken from Bokeh quickstart
Yup - I got new friend. Plotting with Bokeh looks very interesting in terms of visualizing huge, browsable dataset.